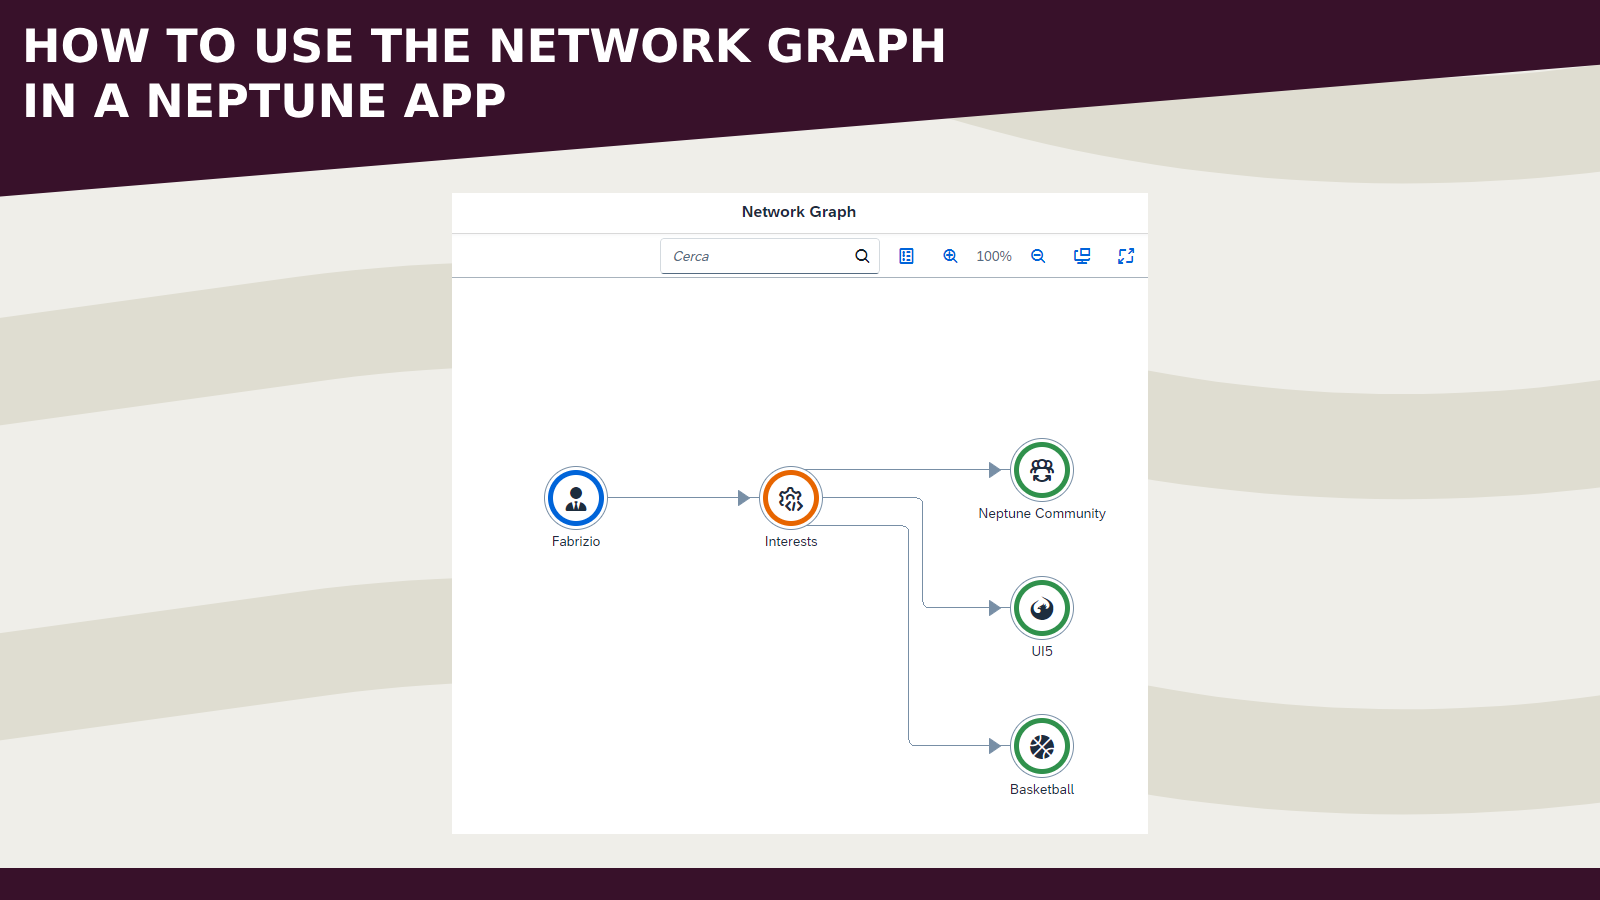
The Network Graph is a UI5 element that allows to display data as a network of nodes connected by lines.
Since I have not found an example in the Neptune Explored today I want to share how I used it in Neptune DXP (SAP Edition).
- First of all declare the GS_GRAPH attribute, it will be a structure containing two tables (nodes and lines)
TYPES:
   BEGIN OF ty_nodes_str,
     id    TYPE string,
     title TYPE string,
     icon  TYPE string,
     status TYPE string,
   END OF ty_nodes_str.
 TYPES:
   BEGIN OF ty_lines_str,
     from TYPE string,
     to   TYPE string,
   END OF ty_lines_str.
 TYPES:
   ty_nodes TYPE TABLE OF ty_nodes_str WITH NON-UNIQUE DEFAULT KEY,
   ty_lines TYPE TABLE OF ty_lines_str WITH NON-UNIQUE DEFAULT KEY.
 TYPES:
   BEGIN OF ty_graph,
     nodes TYPE ty_nodes,
     lines TYPE ty_lines,
   END OF ty_graph.
 DATA gs_graph TYPE ty_graph.
- Then create a new method (GET_GRAPH_DATA) and add some example data
data ls_lines type ty_lines_str.
data ls_nodes type ty_nodes_str.

ls_lines-from = '1'.
ls_lines-to = '2'.
append ls_lines to gs_graph-lines.

ls_lines-from = '2'.
ls_lines-to = '3'.
append ls_lines to gs_graph-lines.

ls_lines-from = '2'.
ls_lines-to = '4'.
append ls_lines to gs_graph-lines.

ls_lines-from = '2'.
ls_lines-to = '5'.
append ls_lines to gs_graph-lines.

ls_nodes-id  = '1'.
ls_nodes-title = 'Fabrizio'.
ls_nodes-icon = 'sap-icon://fas/user-tie'.
ls_nodes-status = 'Information'.
append ls_nodes to gs_graph-nodes.

ls_nodes-id  = '2'.
ls_nodes-title = 'Interests'.
ls_nodes-icon = 'sap-icon://developer-settings'.
ls_nodes-status = 'Warning'.
append ls_nodes to gs_graph-nodes.

ls_nodes-id  = '3'.
ls_nodes-title = 'Neptune Community'.
ls_nodes-icon = 'sap-icon://collaborate'.
ls_nodes-status = 'Success'.
append ls_nodes to gs_graph-nodes.

ls_nodes-id  = '4'.
ls_nodes-title = 'UI5'.
ls_nodes-icon = 'sap-icon://sap-ui5'.
ls_nodes-status = 'Success'.
append ls_nodes to gs_graph-nodes.

ls_nodes-id  = '5'.
ls_nodes-title = 'Basketball'.
ls_nodes-icon = 'sap-icon://fas/basketball'.
ls_nodes-status = 'Success'.
append ls_nodes to gs_graph-nodes.
- Create a new application and assign the correct Application Class
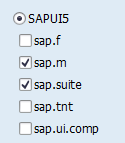
- If you are using the App Designer from the SAP GUI make sure to select the sap.suite option in the App Library settings
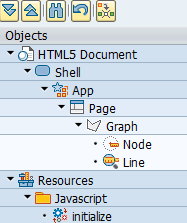
- In a page add a new sap.suite.ui.commons.networkgraph.Graph object with inside a Node and a Line (you can find them in sap.suite > Networkgraph)
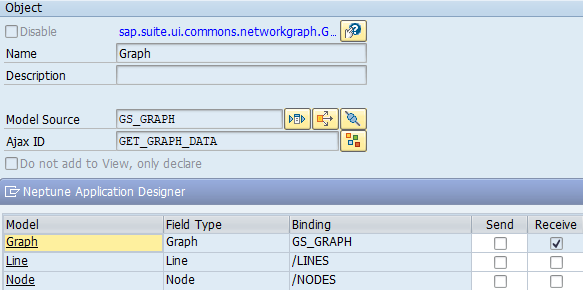
- Select the Graph object to bind the GS_GRAPH attribute and use the GET_GRAPH_DATA method as Ajax ID (the receive flag needs to be set on the Graph object only)
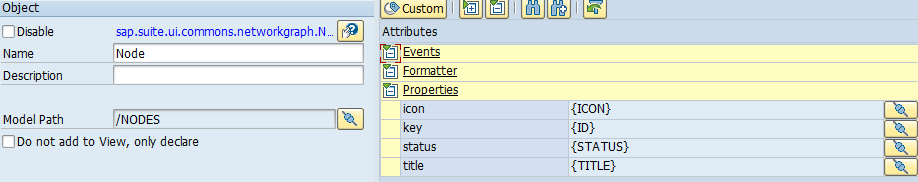
- In the Node object use the /NODES model path and bind the icon, key, status and title properties
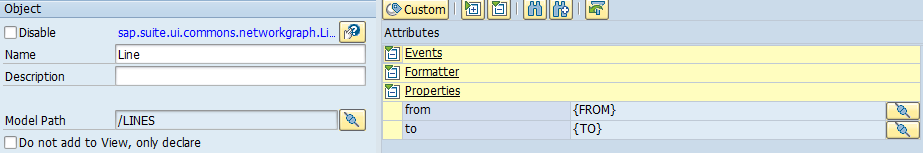
- In the Line object use the /LINES model path and bind the from and to properties
- Finally in the initialize script we can call the class method
    sap.ui.getCore().attachInit(function(data, navObj) {
        getOnlineGraph();
    });
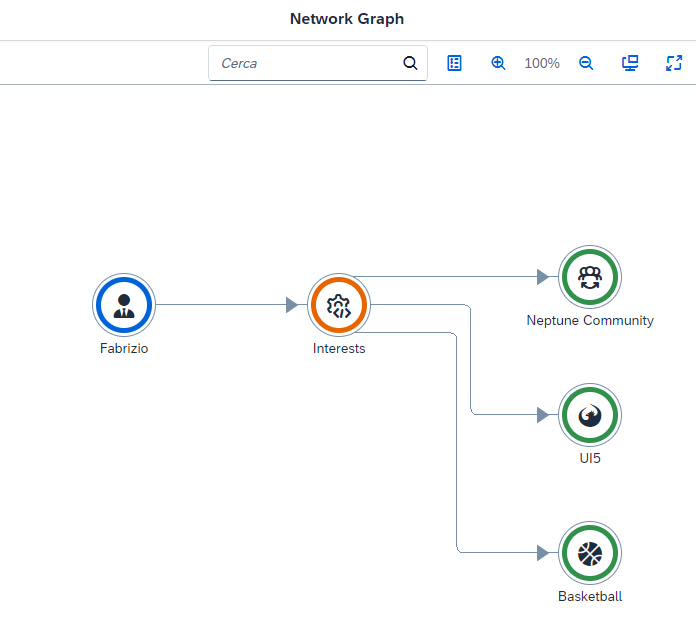
Here a GIF:
- The code can be improved and readapted for specific scenarios
- More complex graphs can be built
Hope this helps
Happy coding!